
Math
The Math exercises focus on dynamic graphing solutions, identifying graph coordinates, demonstrating key mathematical formula outputs and modeling common word problems. Games are also included to challenge the student to identify equivalences, functions and proportions.
Below are several examples you can use here or within a free class account customize for your classroom needs or to save student work
Binomial Game
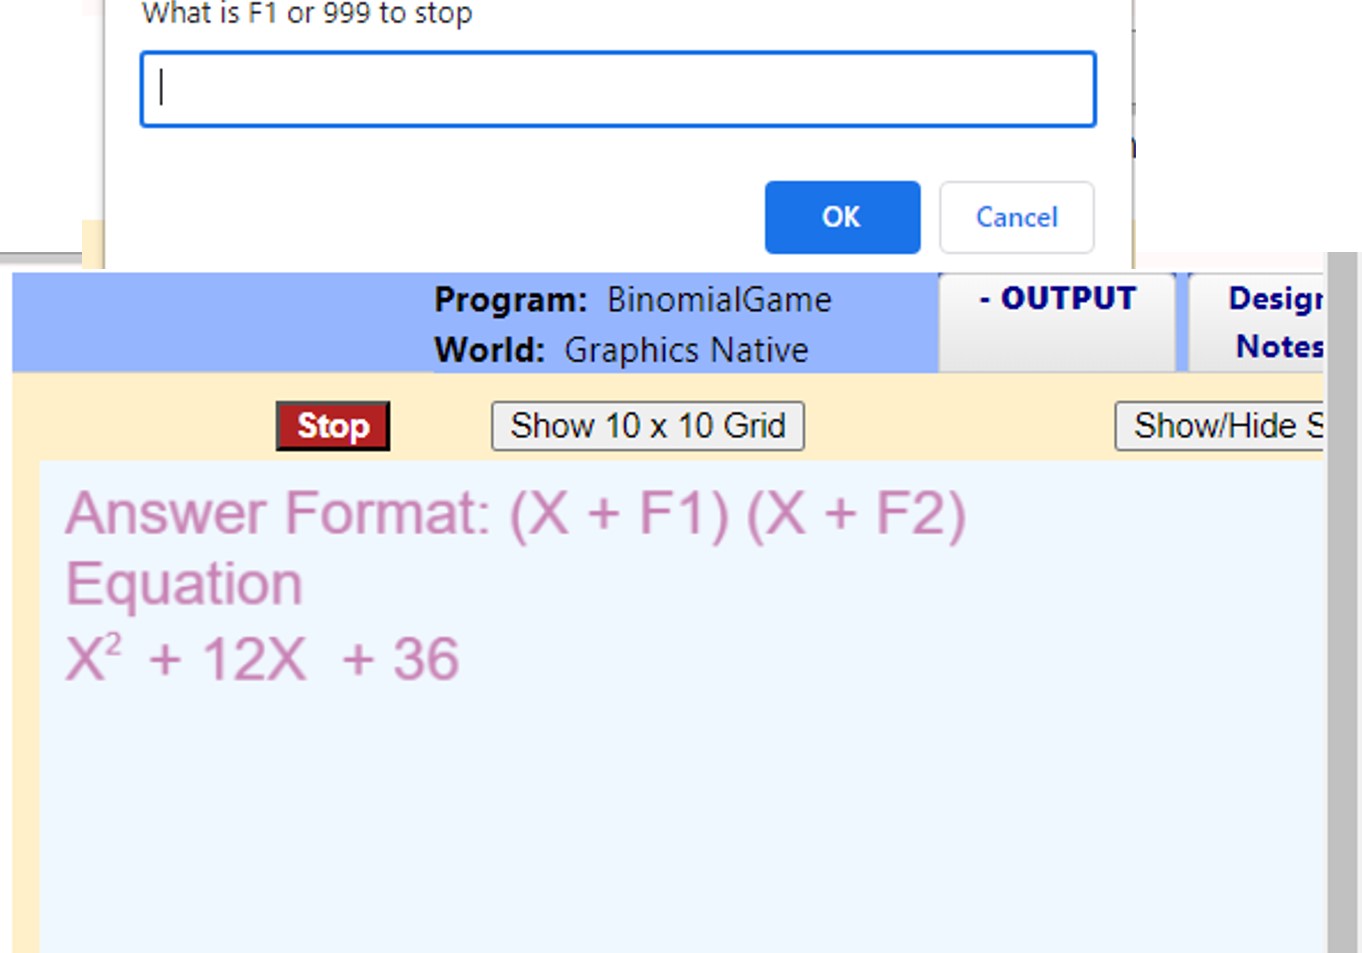
The Binomial games allows students to guess the factors of a binomial equation. The model generates an equation with two factors and prompts the students for those coefficients. The model provides a good over view of how a computer game is structured. The instructions include generating random numbers and asking the students for the coefficients until the correct set is provided. Students can modify the model by changing the random number range to increase or decrease of the set of coefficients chosen.
Riemann Sum
Calculations
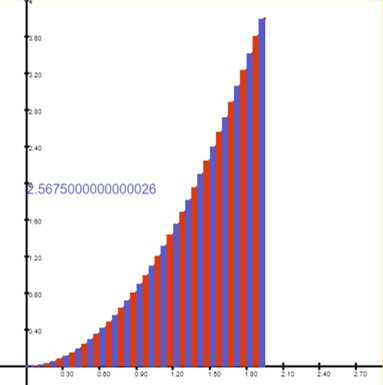
The model produces a Riemann sum calculation by creating rectangles for intervals under a curve. The students can see the generation of the rectangles for the initial equation of y = x squared. The model can then be adjusted to reduce the intervals between points considered, narrowing the rectangles and coming closer to the integral value. Students can also change the equation using trigonometric functions, logs or exponents. The model contains only about 25 instructions where clearly demonstrate the Riemann sum calculation approach through rectangle generation. The model can also be adjusted to use the various Rules or options of the Riemann sum calculation.
Pick a Function
Game
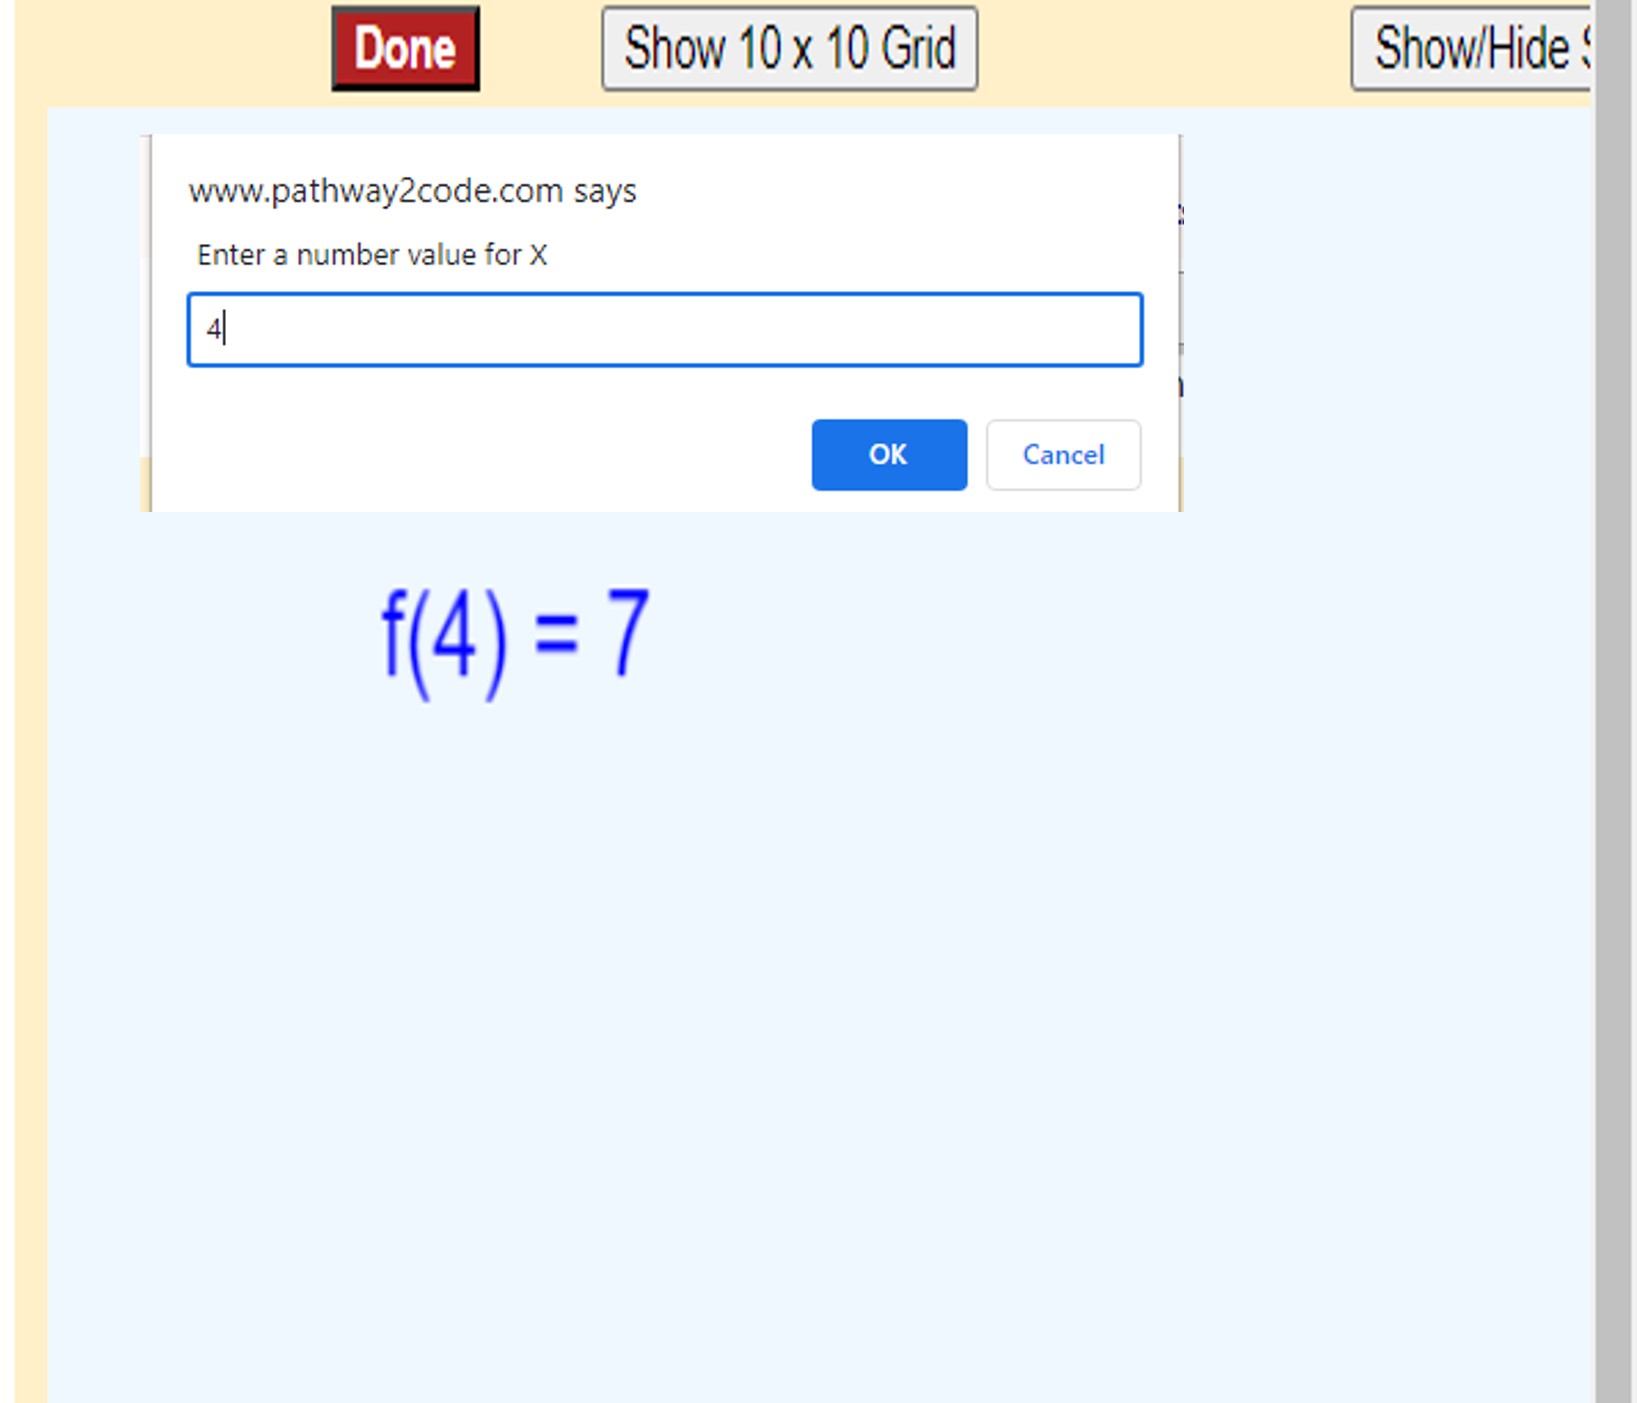
The Pick Function exercise challenges the student to select a function that matches the entered input and displayed output. Three functions containing simple equations are included in the model. The student runs the model and is prompted for an input. That input is fed into one randomly chosen function of the set of model functions. The result is displayed in a f(x) = y format. From this information the student can pick which function was randomly chosen. The seed of the random number generator is modified each time to produce different results for each model execution. A worksheet can capture the student's analysis for each different seed used. The model can be enhanced by adding more functions and or changing existing functions.
Linear Slopes
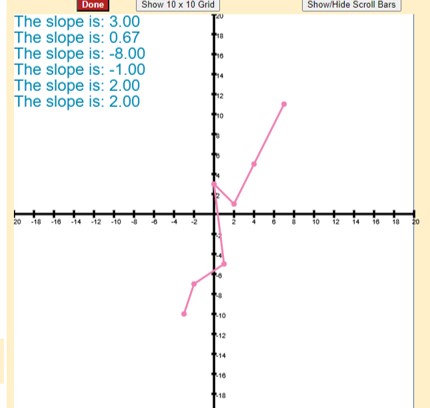
"Let's make it linear" provides the student with a set of points, which are not quite points on a linear line. The student needs to make some small changes so that all points are one the same line. Generally only 2 of the points in the provided set fall outside the line created by the other lines. The model demonstrates how a computer can use a list of coordinate points and through a repetition structure (loop) plot and connect each dot. The two sets of points provided can be modified by the instructor or students after the first iterations of the exercise. Instructions such as m=(Points[p2][2]-Points[p1][2])/(Points[p2][1]-Points[p1][1]) illustrate how equations studied in class can be used by the computer to determine slope. Instructions as Plot(Points[n][1],Points[n][2]) refer to the x, y coordinate of point in the lists with the 2 Setup functions.
Loan Payments
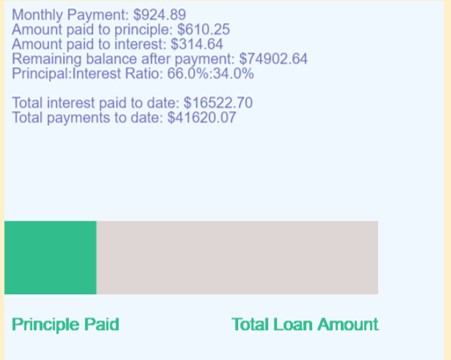
This exercise provides some financial calculations to determine the remaining balance of a loan. After the key input data is captured, the program loops through the payment cycles decreasing principal and interest owed over time. The student can watch the percentage of the load slowly drop over time. Enhancements to the model can be made to show more interim values, change the cosmetics of the output, and the speed of the payment graph display. The model can be used a basis for another exercise to figure compound interest and other elementary display calculations.
Plane Game
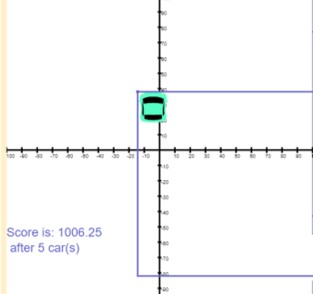
The plane game is a challenge for the student to read the coordinates of a graph. A car is shown at a location of the two-dimensional graph, and the student is prompted for the X, Y coordinates. The distance of the student's coordinate entry and the true coordinates is calculated and added to a running total of this distance delta. The game also shows the use of randomness by randomly selecting a car and of course the coordinate points for each prompt. Students can modify the range of X, Y coordinates chosen and the number of prompts per game. Advanced students could change the model to display the quadrant of the coordinate as well.
Complex Number Multiplication
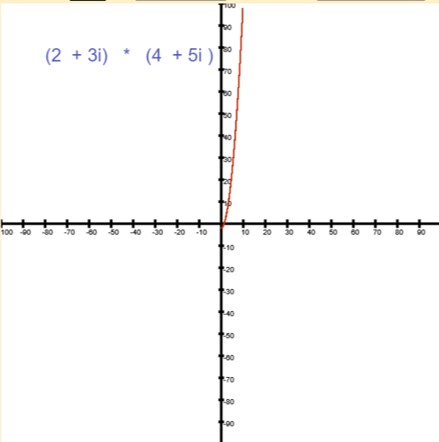
Complex Number Multiplication involves finding the product of two complex numbers. The real and imaginary coefficients of both numbers are inputs to the model. The model the multiplication and then shows the resulting equation on a graph. Students can be asked to write the formulas for the product within a target function, or simply use the function provided and try differing inputs. The model does include repetitive loop structure that spins through 1000 X coordinates and plots its corresponding Y coordinate on the graph.
Quadratic Equation
Graphing
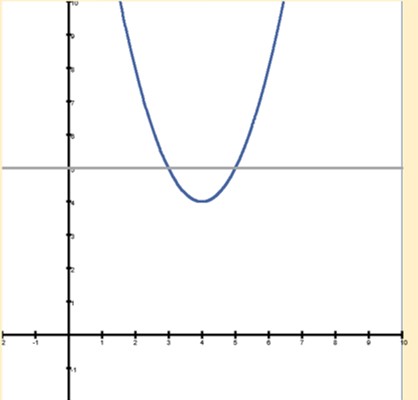
This exercise is a basic quadratic equation graphing tool. A specific function named Function1 is holds the actual equation. Students see the repetitive loop structure that plots points in a specified range. Students can change the range, the equation within the function and the cosmetics (graph colors and line thickness). Advanced students can modify the model by adding an additional function holding another equation, in order to display two equations on the screen at the same time. Additionally, students can make the equations in the function hold random coefficients.
BlockShape
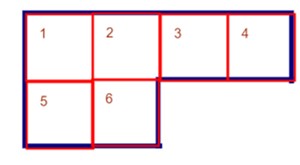
The Block Shape exercise challenges young students to create a blank space and then fill in the space with equal size rectangles. The model prompts the students for the dimension of the space and then the rectangles. Students can click on locations to place a rectangle. Instructors can give challenges of finding dimensions that hold a particular n number of rectangles of a given size. The model has a function(P2CMouseClickEvent) that handles the logic of the model when the mouse is clicked. This logic draws a rectangle at the click location of the mouse, regardless of previous clicks. The exercise is aimed to younger students and seeks to common technology goals of inputting data and handling user actions.
Equivalent
Fractions
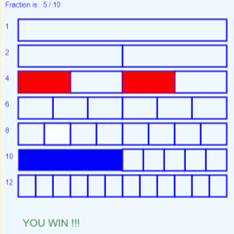
Equivalent Fractions is geared to assist younger students visually see sets of equivalent fractions. A series of rows are divided into partitions of 1,2,4,6,8,10,12. A fraction is randomly chosen and displayed. Also, the row of the fraction's denominator has a number, based on the fraction numerator, partitions given a solid color. This action visually displays the fraction. The student then can pick another row and click (to color) a few partitions, so the two rows are equivalent fractions. This click logic of the mouse draws a solid rectangle at the click location of the mouse. The exercise is aimed at younger students emphasize how the computer can illustrate challenging concepts and react to user events such as a mouse click.