
Social Studies
Topics For Social Studies
These exercises seek to enhance the discussion of topics covered in social studies classes. The models enable students to create lists and graphs that relate to these topics. Animation models also provide a time lapse of data to understand trends. The exercises help students explore some deeper level concepts not possible with text material.
Little Rock Schools
Elizabeth Eckford
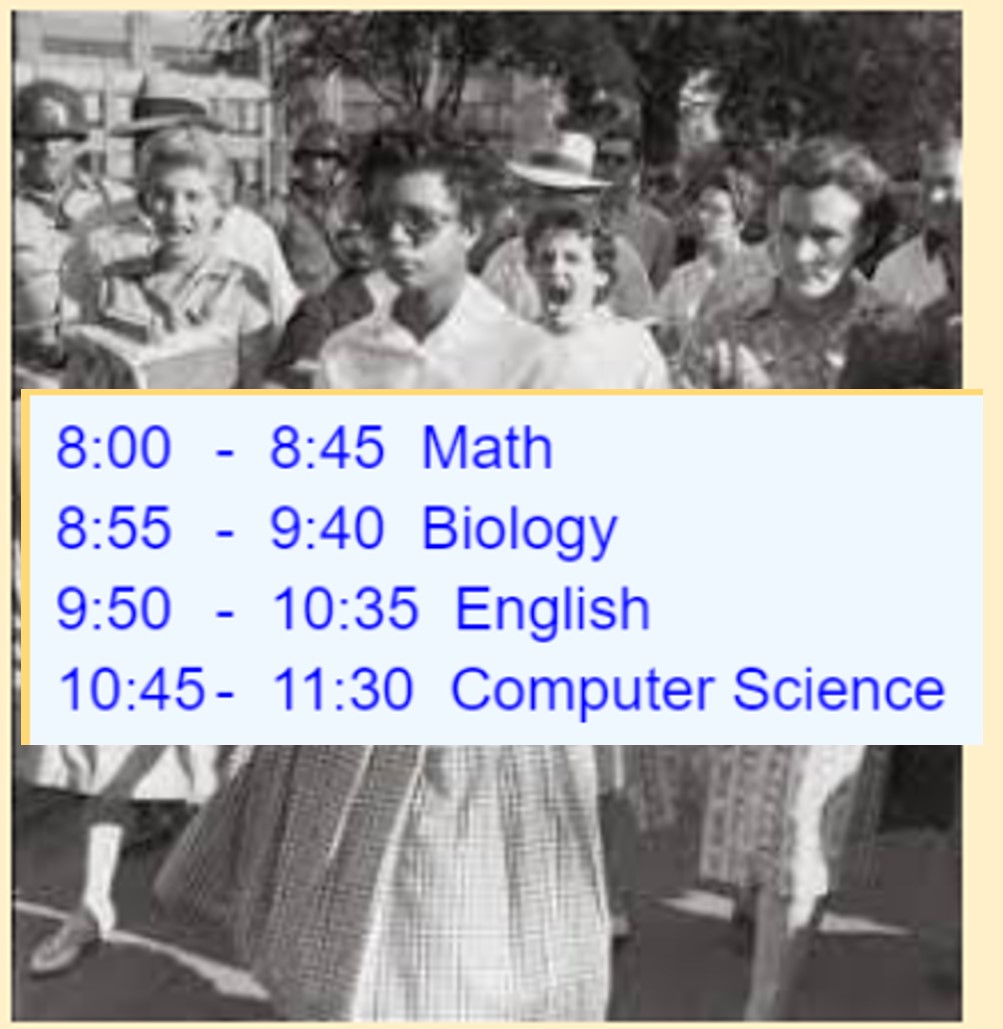
This exercise assists the students in continuing the discussion about Elizabeth Eckford's high school experience. The model prints a tentative schedule for her school day. Students can discuss the schedule and make their own modifications of her schedule. For example, a computer science class is initially presented, however that topic was not taught in high schools in 1956. The model illustrates how the computer stores data in lists and maintains information (e.g. the starting hour of the day , and time between classes) in storage locations (variables). Students make changes to the model to create Elizabeth's schedule to match their perception of her school day.
Westward Expansion
Wagon Train
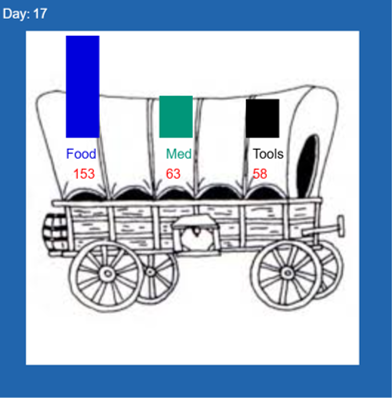
This exercise is modeled off the traditional “Oregon Trail” game, where a wagon is loaded with supplies and must reach the west coast, before food and their equipment is completely used. The model provides 3 approaches to enter data about the 3 categories of supplies (food, medicine, tools). The first approach is to prompt the user, the second is randomly select a number, and the third to hard-code the value, so it is the same across trips (runs of the program). The model provides a bar chart animation showing the usage rate during the trip. Random variables are used each period of the trip to reduce the supplies. Some reductions like food are constant. Students have the ability to change the various model hard coded values, switch type of input per supply category and even provide warning when supplies are low.
Opioid Overdose Demographics

This exercise enables the student to study different trends of data related to the opioid epidemic announced by the CDC in 2017. The data has a row for each year. The information on a row is the year, followed by the number of deaths (thousands) in each of 4 population groups - White, Black, Hispanic and Native Americans. The student can pick the population group, modify two instructions (one to plot the point, the other to feed the regressions model) , and then run the model to the pattern. Students can add to the model by including instructions for printing the population group chosen and the slope and y-intercept of the line.